Digital inspection systems often face budget scrutiny despite delivering clear operational benefits. Finance departments rightfully demand quantifiable returns, not vague promises of "improved efficiency." The good news: digital inspection ROI is straightforward to calculate and impressive to present. Organizations typically achieve full payback within 6-12 months, then continue realizing annual value 3-5 times the system cost.
Understanding Total Costs: Paper vs. Digital
Paper inspections appear "free" until you calculate their hidden costs across labor, materials, storage, and risk exposure:
Paper Inspection Costs (Annual, 20-Unit Fleet)
- Inspection Labor: 15 minutes/inspection × 20 units × 250 days × $25/hour = $31,250
- Form Printing and Storage: Pre-printed forms, copies, filing supplies = $2,500
- Administrative Time: Filing, retrieval, reporting 40 hours/month × $30/hour = $14,400
- Lost Inspection Records: 5-8% lost/misfiled requiring recreation or exposure = $5,000
- Delayed Deficiency Response: Late detection causing reactive repairs instead of proactive = $25,000
- OSHA Citation Risk: Poor documentation increasing violation probability = $15,000 risk value
Total Annual Paper Cost for 20-unit fleet: $93,150
Digital Inspection Costs (Annual, 20-Unit Fleet)
- System Subscription: Typical $100-200/unit/year = $3,000
- Implementation Time: One-time 40 hours setup × $50/hour = $2,000 (first year only)
- Training Time: Initial 2 hours/operator × 25 operators × $25/hour = $1,250 (first year only)
- Mobile Devices: If not already available, $300/device × 20 = $6,000 (one-time)
- Ongoing Support: Included in subscription = $0
Total First Year Digital Cost: $12,250 (then $3,000 annually thereafter)
ROI Reality: Even with full implementation costs, digital systems save $80,900 in year one ($93,150 - $12,250) and $90,150 annually thereafter. That's a 660% first-year return and 3,000%+ ongoing annual returns.
Quantifiable Benefit Categories
Digital inspection ROI comes from multiple benefit streams, each independently justifying the investment:
1. Direct Labor Savings
- Inspection Time Reduction: 50% faster completion (15 min to 7 min) saves 8 min/inspection
- Elimination of Filing: Zero time spent filing, retrieving, or copying paper forms
- Automated Reporting: Instant report generation vs. 40 hours/month manual compilation
- No Lost Form Recreation: Elimination of time spent recreating lost or damaged records
For 20-unit fleet: Labor savings alone = $45,000/year
2. Improved Compliance and Risk Reduction
- 99.9% Inspection Retention: Virtually eliminating "can't find the inspection" during audits
- Complete Audit Trail: Automatic timestamps, GPS locations, photo documentation
- Faster OSHA Audits: Hours vs. days to produce required documentation
- Citation Prevention: Better documentation quality reducing violation probability by 60-80%
- Liability Protection: Comprehensive records defending against injury claims
Risk reduction value: $20,000-50,000/year depending on citation history
3. Equipment Reliability and Maintenance Optimization
- Earlier Deficiency Detection: Real-time alerts enabling proactive repairs
- Trend Analysis: Identifying patterns impossible to see in paper records
- Prevented Failures: 15-25% reduction in emergency repairs through early intervention
- Extended Equipment Life: Better maintenance timing extending asset lifespan 10-20%
- Reduced Downtime: 2-5% improvement in equipment availability
Maintenance and availability value: $30,000-75,000/year
Real ROI Examples by Fleet Size
ROI scales with fleet size while per-unit costs often decrease with volume:
Small Fleet (5 units)
- Annual Paper Costs: $23,000
- Digital System Cost: $1,500/year (after first year)
- Annual Savings: $21,500
- Payback Period: 4-6 months
- Ongoing ROI: 1,433%
Medium Fleet (20 units)
- Annual Paper Costs: $93,000
- Digital System Cost: $3,000/year
- Annual Savings: $90,000
- Payback Period: 3-4 months
- Ongoing ROI: 3,000%
Large Fleet (100 units)
- Annual Paper Costs: $465,000
- Digital System Cost: $12,000/year (volume pricing)
- Annual Savings: $453,000
- Payback Period: 1-2 months
- Ongoing ROI: 3,775%
Scale Advantage: Larger fleets achieve faster payback and higher ROI percentages due to fixed administrative savings and volume pricing on digital systems.
Intangible Benefits Worth Noting
Beyond quantifiable savings, digital inspections deliver valuable intangible benefits:
- Operator Satisfaction: Faster, easier inspections improving employee experience
- Management Visibility: Real-time fleet health dashboards enabling proactive decisions
- Professional Image: Modern systems demonstrating operational sophistication to customers and partners
- Competitive Advantage: Operational efficiency improvements vs. competitors using paper
- Environmental Impact: Elimination of paper consumption and storage space
- Data Analytics: Historical data enabling continuous improvement impossible with paper
- Scalability: Easy expansion to additional locations without proportional administrative burden
Building Your ROI Business Case
Presenting ROI to decision-makers requires combining quantitative analysis with clear value narrative:
ROI Presentation Framework
- Current State Costs: Document actual paper inspection costs including hidden labor
- Digital System Costs: Get specific quotes for your fleet size and requirements
- Quantified Benefits: Calculate savings across labor, compliance, and maintenance
- Payback Timeline: Show when investment breaks even (typically 3-12 months)
- Ongoing Returns: Demonstrate year 2+ annual value realization
- Risk Mitigation: Highlight compliance and liability protection value
- Implementation Plan: Show low-risk rollout approach with pilot validation
- Success Metrics: Define KPIs to track actual vs. projected returns
Validating ROI Through Pilot Programs
Skeptical finance teams appreciate pilot programs that prove ROI before full commitment:
- Pilot Scope: Start with 3-5 units for 30-60 days alongside existing paper process
- Baseline Metrics: Document current inspection time, compliance issues, and maintenance costs
- Track Pilot Results: Measure actual time savings, deficiency detection, and user satisfaction
- Compare Approaches: Run parallel paper/digital showing concrete differences
- Scale Projections: Extrapolate pilot results to full fleet for business case validation
- Decision Point: Expand or halt based on actual measured returns vs. projections
Digital inspection ROI isn't theoretical—it's demonstrable, measurable, and repeatable across organizations and industries. The question isn't whether digital inspections deliver value, but how quickly you can begin capturing that value for your organization. With payback periods measured in months and ongoing returns measured in multiples of investment, digital transformation of inspections represents one of the highest-return technology investments available to equipment-intensive organizations.
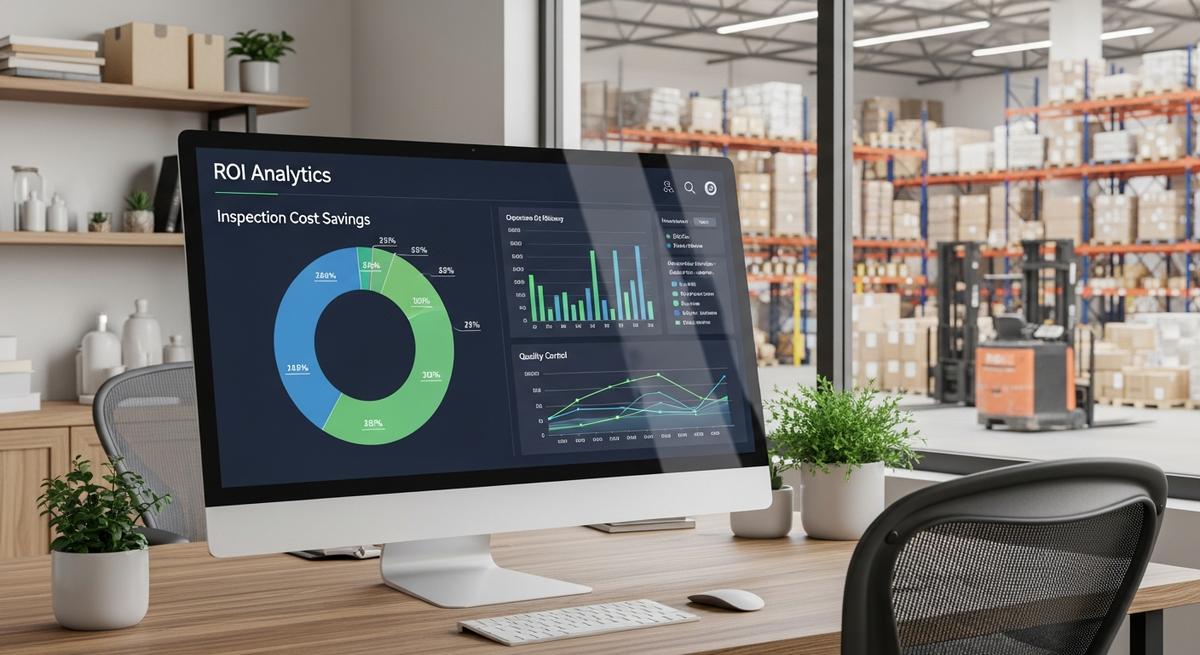
Beyond Cost Savings: Analytics Dashboard Business Intelligence Value
While direct cost savings justify digital inspection investments, the real transformational value comes from analytics capabilities that turn inspection data into actionable business intelligence. Modern digital platforms include analytics dashboards that visualize fleet health, identify trends, and enable data-driven decisions impossible with paper systems.
Real-Time Fleet Health Visibility
Analytics dashboards provide instant, comprehensive views of fleet condition across all equipment and locations:
- Equipment Status at a Glance: Color-coded fleet overview showing operational, deficient, and out-of-service units
- Compliance Tracking: Real-time monitoring of inspection completion rates by equipment, location, and shift
- Deficiency Analysis: Identification of recurring issues, high-deficiency equipment, and systemic problems
- Maintenance Workload Forecasting: Predictive views of upcoming maintenance requirements based on inspection trends
- Utilization Patterns: Understanding which equipment is working hardest and may need additional maintenance attention
- Cost Center Analysis: Tracking maintenance spend and downtime costs by equipment type, location, or department
Executive Value: Analytics dashboards transform safety managers from compliance administrators into strategic advisors. Real-time data enables proactive decision-making, budget optimization, and defensible capital planning recommendations based on objective equipment health metrics.
KPI Tracking and Benchmarking Capabilities
Digital platforms track key performance indicators that quantify operational excellence and demonstrate continuous improvement:
- Inspection Compliance Rate: Percentage of required inspections completed on time, tracked by equipment, operator, and location
- Deficiency Detection Rate: Number of issues caught per 100 inspections, indicating thoroughness and equipment condition
- Mean Time to Repair: Average time from deficiency identification to resolution, measuring maintenance responsiveness
- Equipment Availability: Uptime percentage accounting for maintenance, failures, and inspection downtime
- Cost Per Inspection: Fully-loaded inspection costs including labor, technology, and administrative overhead
- Safety Incident Correlation: Linking inspection findings to accident prevention and injury rate improvements
- Year-over-Year Improvement: Trending KPIs to demonstrate program maturity and continuous improvement
Data-Driven Capital Planning and Equipment Replacement
Analytics enable objective, data-backed equipment replacement decisions rather than age-based or gut-feel approaches:
- Total Cost of Ownership Analysis: Tracking cumulative maintenance costs identifying when equipment becomes economically unviable
- Deficiency Trend Prediction: Identifying equipment entering high-maintenance end-of-life phase requiring replacement
- Reliability Comparison: Benchmarking different equipment makes, models, and vintages to inform purchasing decisions
- ROI of Replacement: Quantifying savings from replacing high-maintenance units with newer, more reliable equipment
- Fleet Right-Sizing: Understanding actual utilization patterns to optimize fleet size and composition
Budget Justification: Analytics transform capital requests from "we need new forklifts" to "Unit FL-217 has averaged $18,400 in annual maintenance over the past 18 months versus $4,200 fleet average. Replacement delivers $14,200 annual savings with 18-month payback."
Case Study: Distribution Center Achieves 340% ROI Through Analytics-Driven Optimization
Midwest Distribution Corp operated 85 forklifts across two facilities with annual maintenance costs of $680,000 and chronic equipment availability issues. After implementing digital inspections with analytics dashboards, they achieved remarkable returns by leveraging data insights:
Analytics-Enabled Improvements
- Fleet Right-Sizing: Analytics revealed 12 units with <15% utilization rates. Redeploying to higher-use locations eliminated need for 8 additional units, saving $240,000 capital
- Targeted Replacements: Identified 6 units consuming 34% of total maintenance budget. Replacing them reduced annual maintenance by $142,000
- Shift Balancing: Discovered night shift inspections averaging 12 minutes longer than day shift. Additional training reduced inspection time by 8 minutes per unit per night, saving $26,000 annually
- Preventive Maintenance Optimization: Analytics showed hydraulic system failures correlating with 90-day fluid change intervals. Moving to 60-day changes reduced emergency repairs by 68%, saving $89,000 annually
- Vendor Performance: Identified one maintenance vendor with 3x higher return rate on repaired equipment. Switching vendors improved first-time fix rate from 71% to 94%
Quantified Three-Year Results
- Total Investment: $62,000 (digital system, telematics, training)
- Year 1 Savings: $287,000 (process improvements and reduced maintenance)
- Year 2-3 Additional Savings: $240,000 capital avoidance + $497,000 ongoing operational savings
- Cumulative 3-Year ROI: 340% return on investment
- Intangible Benefits: 47% improvement in equipment availability, 62% reduction in safety incidents, 89% increase in operator satisfaction
Leadership Perspective: "We bought a digital inspection system and discovered we'd been managing our fleet blind for 15 years. The analytics showed us exactly where we were wasting money and how to fix it. The inspection system paid for itself in 2 months; the analytics continues paying dividends every quarter." - VP of Operations, Midwest Distribution Corp
Choosing Analytics-Enabled Digital Inspection Platforms
Not all digital inspection systems offer equivalent analytics capabilities. When evaluating platforms, assess analytical features as critically as basic inspection functionality:
Essential Analytics Dashboard Features
- Real-Time Dashboards: Live data visualization updating as inspections are completed, not batch-processed overnight
- Customizable Views: Ability to create role-specific dashboards for operators, supervisors, managers, and executives
- Trend Analysis: Historical data visualization showing improvement or degradation over time
- Drill-Down Capability: Ability to click dashboard metrics to access detailed underlying data
- Export Functionality: Download data for additional analysis in Excel, business intelligence tools, or presentations
- Mobile Access: Dashboard availability on smartphones and tablets for field decision-making
- Benchmark Comparison: Industry or internal fleet benchmarks contextualizing your performance
- Automated Reporting: Scheduled delivery of analytics summaries to stakeholders without manual compilation
Advanced Analytics Capabilities
Organizations seeking maximum value should prioritize platforms offering advanced analytical features:
- Predictive Analytics: Machine learning identifying failure patterns and predicting future maintenance needs
- Anomaly Detection: Automatic flagging of unusual inspection patterns requiring investigation
- Root Cause Analysis Tools: Correlation analysis connecting deficiencies to operational factors
- Multi-Site Comparison: Benchmarking performance across multiple facilities or divisions
- Integration with BI Tools: Data connectivity to Tableau, Power BI, or other enterprise analytics platforms
- API Access: Ability to extract data programmatically for custom analysis or external system integration
Maximizing ROI: Best Practices for Analytics Adoption
Purchasing analytics-enabled platforms is necessary but insufficient. Realizing full value requires organizational adoption and data-driven culture:
- Executive Dashboard Reviews: Schedule monthly leadership reviews of key metrics, holding departments accountable for trends
- Data-Driven Problem Solving: Require analytics support for all maintenance and capital decisions
- Continuous Improvement Cycles: Use quarterly data reviews to identify optimization opportunities
- Frontline Engagement: Share relevant analytics with operators and technicians, empowering data-informed improvements
- Benchmark Celebration: Publicly recognize teams and individuals achieving top-quartile performance
- Predictive Response: Act on analytical insights before problems manifest, not after failures occur
The digital inspection transformation journey begins with cost savings but matures into strategic competitive advantage through analytics-driven optimization. Organizations that master both the data collection and the data analysis dimensions of digital inspections don't just save money—they fundamentally transform how they manage assets, allocate resources, and compete in their markets. The question isn't whether analytics deliver value; it's whether you can afford to make decisions without them.